SQL Data Exploration Project | Healthcare Dashboard
A portfolio case study built from healthcare analytics data, where SQL handled the core queries, Power Query shaped the model inside Power BI, and DAX powered the KPI measures and visuals for decision support.
Problem
The raw healthcare data needed to be transformed into a clean reporting model that could highlight patient flow, service demand, performance trends, and operational metrics.
Solution
I wrote the core queries in SQL, used Power Query for data shaping inside Power BI, and built the dashboard with DAX measures for the KPIs and breakdowns.
Dashboard pages
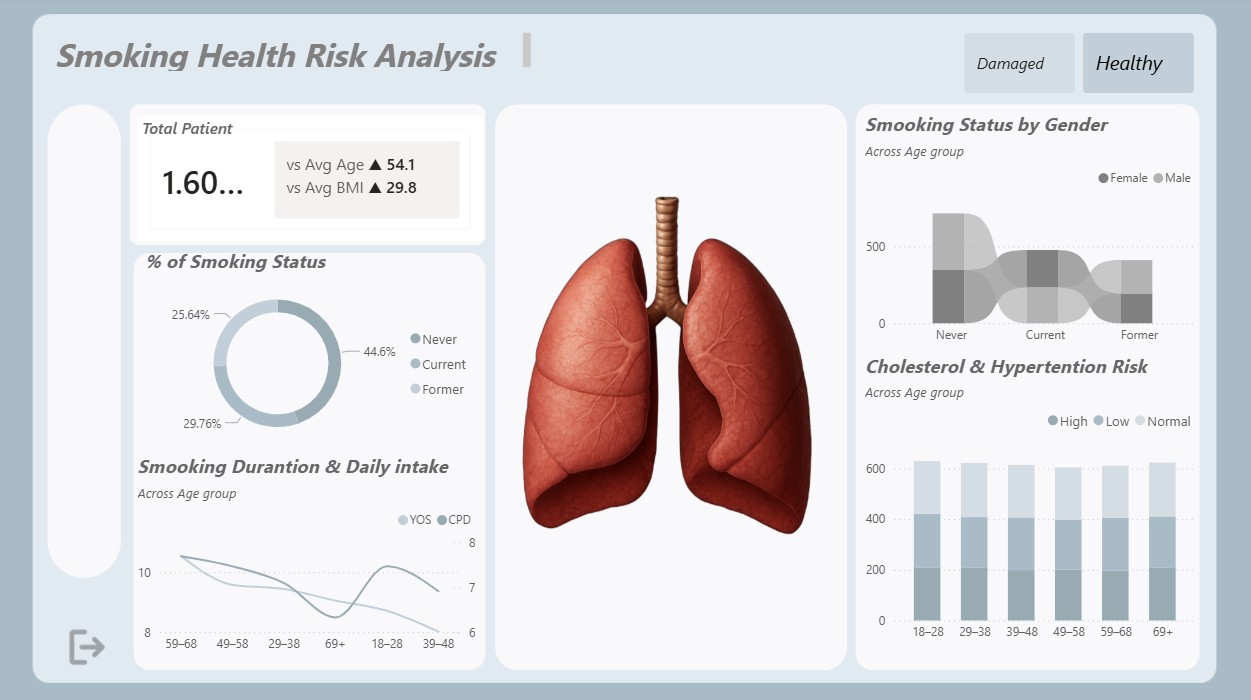
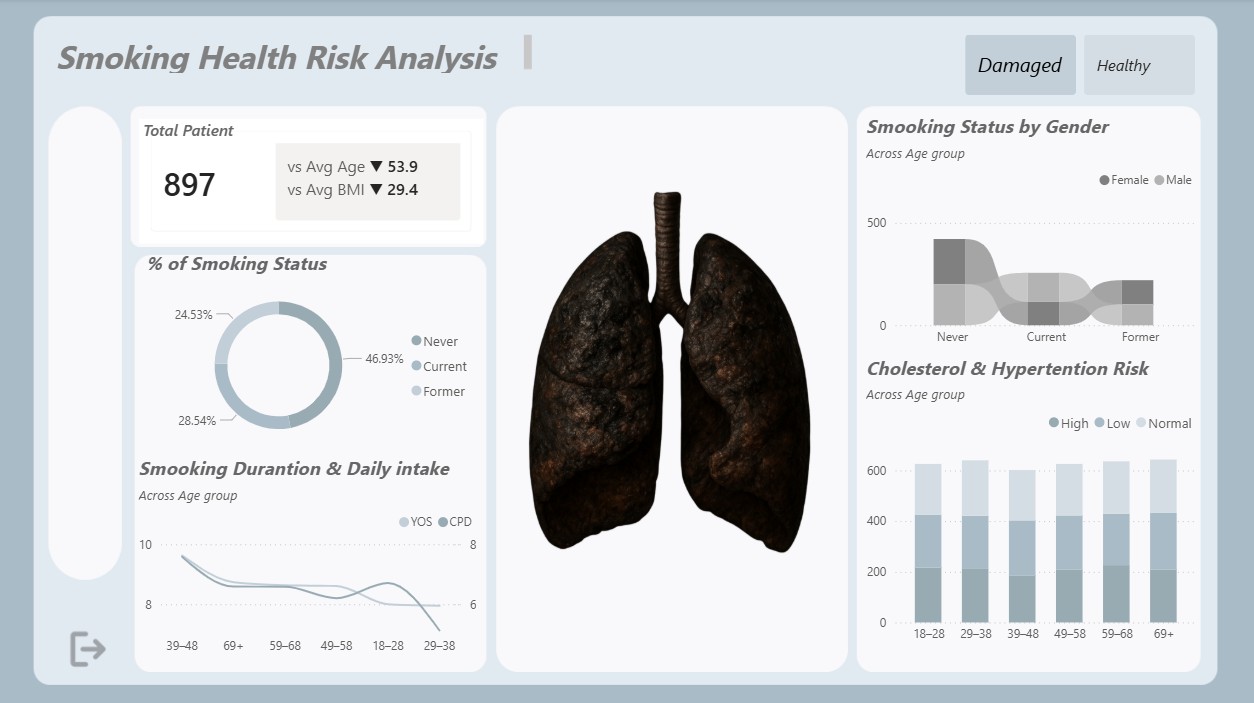
What the report shows
Operational overview
The report opens with the main KPIs: volume, performance, and activity measures that give a quick view of the healthcare operation.
Top and bottom patterns
Ranking visuals make it easy to see which service lines perform best and which ones need attention.
Trend monitoring
Daily and monthly trends show when demand peaks across the year, supporting planning and performance reviews.
Service mix
Service visuals show the operational mix at a glance and make comparison easier during interviews.
How it was built
Query the dataset in SQL
I used SQL to prepare the dataset and shape the base fields that feed the reporting model.
- Load the source tables and validate the structure
- Standardize fields for analysis
- Remove inconsistencies and duplicates
- Prepare a reporting-ready dataset
Shape the model in Power Query
Power Query handled the transformations inside Power BI so the model stayed clean and ready for analysis.
- Apply transformations inside Power BI
- Refine data types and column logic
- Prepare the model for analysis
- Keep the reporting layer lean and reliable
Build KPI measures in DAX
DAX powered the KPI cards, category splits, and ranking visuals used in the report.
- Calculate patient volume and service metrics
- Build measures for totals and averages
- Support top and bottom activity analysis
- Power the dashboard visuals
Deliver the dashboard narrative
The final output is a business-friendly dashboard that turns raw healthcare data into clear, actionable insights.
- Executive dashboard design
- Clear KPI structure
- Data storytelling
- Decision support for business users
Tools and technologies
Why it matters
- How to move from raw data to reporting-ready outputs
- How SQL, Power Query, and DAX work together in one reporting flow
- How Power BI turns metrics into a clear business story
- How to communicate data findings in a portfolio-friendly format